Access to EAC provides two kinds of runtime visibility:
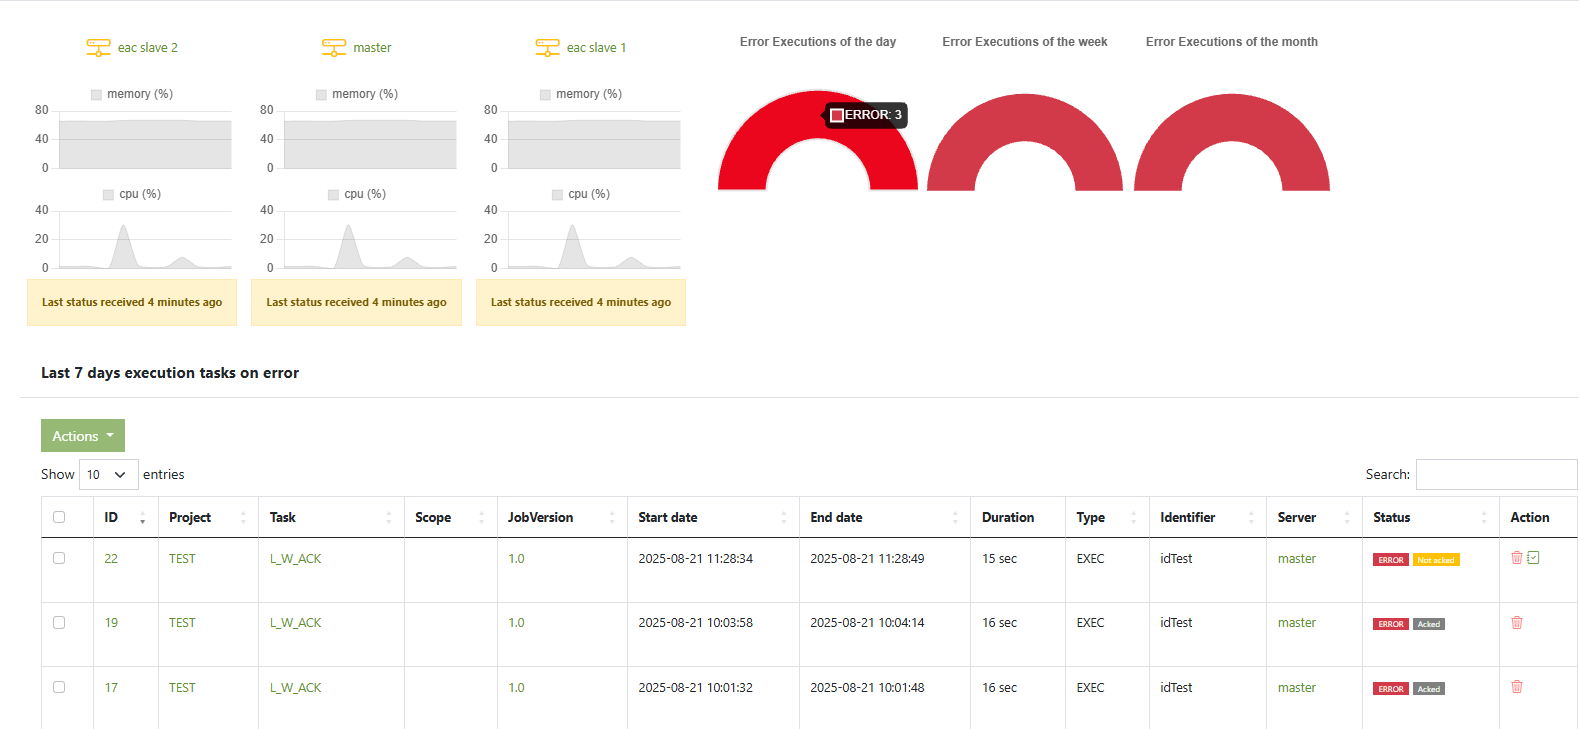
- System monitoring — health of your EAC nodes (CPU %, memory %, last heartbeat) and quick KPIs (error executions per day/week/month).
- Job monitoring — per-execution logs (Execution logs tab) and optional ETL logs (stats/metrics) collected from your ETL logging database.
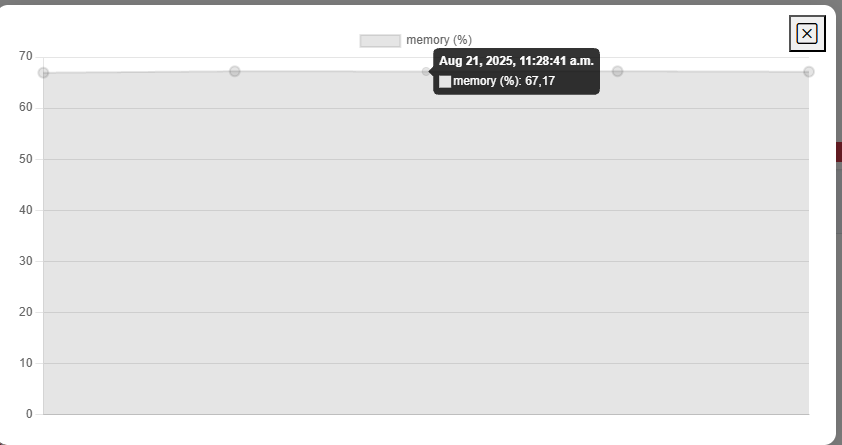
more info on cpu per ping click on the graph a modal will appear with detail
Permissions: You need the Admin role to configure monitoring.
System monitoring (nodes & KPIs)
What you see
- Dashboard: one card per node (master/slaves) with CPU % and memory % sparklines, plus Error Executions gauges (day/week/month).
- Server detail: node status (Active ✓ / Not an execution server), EAC version, and time-series of CPU/memory.
How heartbeats work
Each node periodically sends a status sample (heartbeat) using the console command:
php bin/console eac:server-status --every=3
Schedule it on every EAC node.
Cron example (bare metal / VM)
Run every minute (samples every 3s for ~1 minute):
* * * * * cd /var/www/html/eac && /usr/bin/php bin/console eac:server-status --every=3 --env=prod >/dev/null 2>&1
Troubleshooting (system monitoring)
- “Last status received … hours ago”
Cron/timer not running or wrong working directory/PHP path. Run once manually:php bin/console eac:server-status --every=3 --env=prod -vv - Graphs flat at 0%
The command runs but sampling interval too short. Use--every=3(or higher). - Time drift / weird “ago” labels
Synchronize time (NTP) and verify server timezones. - Permission denied writing logs
Ensure the app dir is owned by your service user/group (see “Server hardening” section of the docs).
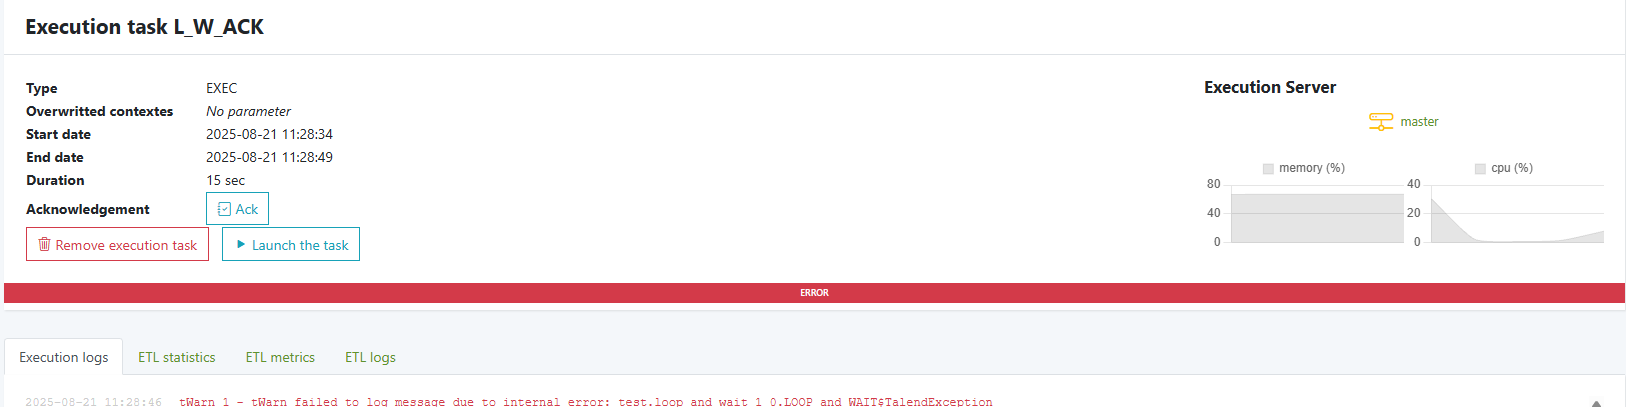
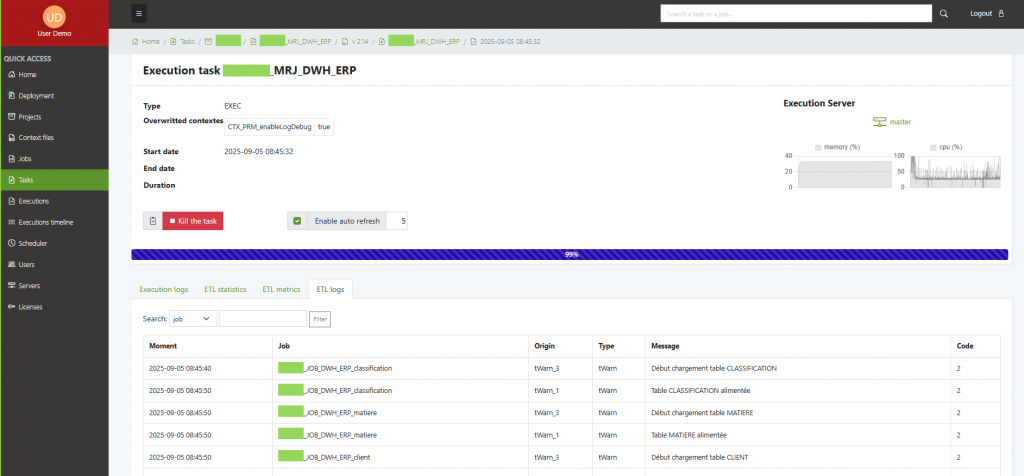
Job monitoring — Execution logs
Every task shows a Execution logs tab with the full runtime output (enqueue → shell/script path → PID → console lines → success/error).
Use it to:
- confirm the script invoked (
*_run.shpath) - check the PID and parameter values
- see final status (“Task completed successfully” or errors)
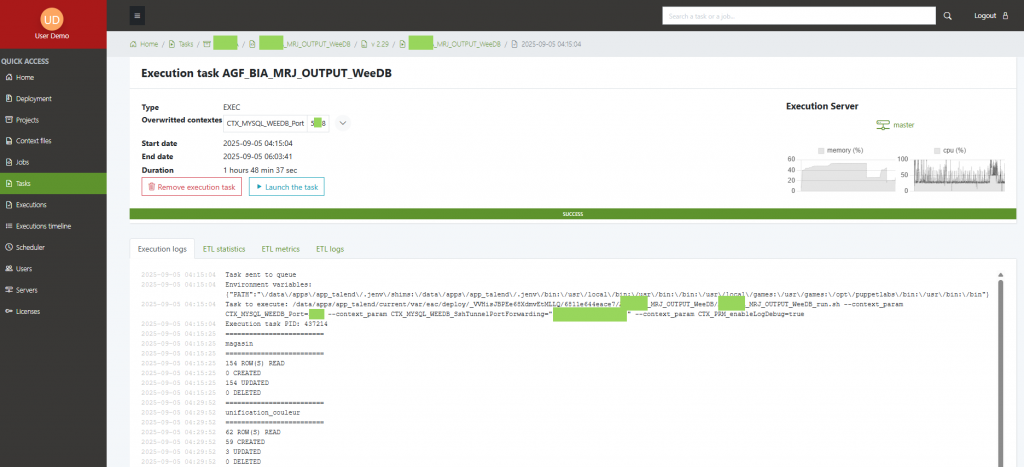
Copy/paste the relevant block when opening support tickets.
Job monitoring — ETL logs (stats & metrics)
EAC can display ETL-level stats and metrics (duration, rows, components, etc.) if your ETL tool writes logs to a database (Talend standard tables supported).
Enable ETL logs
- Enable logging in your ETL studio
Example (Talend): File → Project Settings → Job parameters → “Stats and logs” and select database as target. - Enable ETL logs in EAC
In./shared/.env.local:APP_ENABLE_ETL_LOGS=true - Point EAC to the ETL log database
# MySQL example DATABASE_URL_ETL_LOG="mysql://user:pass@db-host:3306/etl_logs?charset=utf8mb4" # PostgreSQL example # DATABASE_URL_ETL_LOG="postgresql://user:pass@db-host:5432/etl_logs" - Declare the table names (adapt to your ETL logging schema):
ETL_STAT_TABLE_NAME=etl_stat ETL_MET_TABLE_NAME=etl_meter ETL_LOG_TABLE_NAME=etl_log - Link ETL execution to the EAC task
In your main ETL job, print the root PID marker once (Java example; use any component that writes to stdout):System.out.println("@@eac@@root_pid=" + rootPid);EAC uses this marker to correlate the ETL run with the task execution.
Viewing ETL logs
Open a task → ETL logs tab. You’ll see the structured stats/metrics pulled from your ETL log DB alongside the task run.
Troubleshooting (ETL logs)
- No data in ETL tab
APP_ENABLE_ETL_LOGSnottrue, or missingDATABASE_URL_ETL_LOG.- Wrong table names; verify
ETL_*_TABLE_NAMEvalues. - ETL studio still writing logs to files, not DB.
- Can’t connect to ETL DB
- Check credentials/host/firewall.
- Test with a quick CLI:
php -r 'new PDO(getenv("DATABASE_URL_ETL_LOG")); echo "OK\n";'
- Runs aren’t correlated
- Ensure the
@@eac@@root_pid=line prints once per run and reaches stdout (not swallowed by log frameworks).
- Ensure the
Operational tips
Rotate and archive ETL log tables regularly to keep dashboards snappy.application logs and ETL logs
Keep one heartbeat per node (even non-execution nodes) for complete visibility.
In multi-server setups, verify the master and all slaves show recent heartbeats before troubleshooting ETL.
Use separate credentials for the ETL logs database (read-only if possible).


